Fractals are intricate geometric patterns that exhibit self-similarity across various scales. They are created by repeating a simple process, leading to complex structures often found in nature, such as snowflakes, coastlines, and tree branches. The concept of fractals challenges traditional notions of geometry, as they possess non-integer dimensions, meaning their detail increases infinitely with magnification. Fractal mathematics is pivotal in fields like computer graphics, art, and modelling natural phenomena. Notable examples include the Mandelbrot set and the Sierpiński triangle, which illustrate how simple rules can produce astonishing complexity, highlighting the beauty and order inherent in chaos.
“There are upper and lower limits to describe natural objects by fractals. A figure may look like a fern leaf, but continued generation of the “leaf on larger and larger scales produces only a larger and larger fern leaf. A fern “plant” will never be produced. Similarly, there is a smallest scale to which a fractal description applies. As the overall fern leaf pattern is repeated on smaller and smaller scales, eventually the scale of a single fern plant cell will be reached. A single cell does not look like the overall shape.”
-HH Hardey
Here are some codes in matlab/octave to get started with common fractal programming.
Mandelbrot
The Mandelbrot fractal, named after mathematician Benoît Mandelbrot, is a complex and visually stunning set defined by a simple mathematical formula. It is generated by iterating the equation
$$z=z^2+c$$
where c and z are complex numbers.
The boundary of the Mandelbrot set reveals intricate patterns and self-similarity, displaying an infinite variety of shapes and colors upon magnification. Its distinctive bulbous regions and filigree structures illustrate the relationship between chaos and order in mathematics. The Mandelbrot fractal has become iconic in mathematics and art, inspiring countless explorations of fractal geometry and its applications.

function mandelbrotmain()
clear variables; clc;

maxit=200;
x=[-2,1];
y=[-1 1];

xpix=601;
ypix=401;

x=linspace(x(1),x(2),xpix);
y=linspace(y(1),y(2),ypix);
[xG, yG]=meshgrid(x,y);

c=mb(maxit,xG,yG);

figure
imagesc(x,y,c);
colormap([1 1 1;0 0 0]);
axis on;
grind on;

endfunction

function count=mb(maxItr,xG,yG)
c=xG+1i*yG;
count=ones(size(c));
z=c;

for n=1:maxItr
z=z.*z+c;
inside=abs(z)<=2;
count=count+inside;
endfor
endfunction
Sierpinski triangle
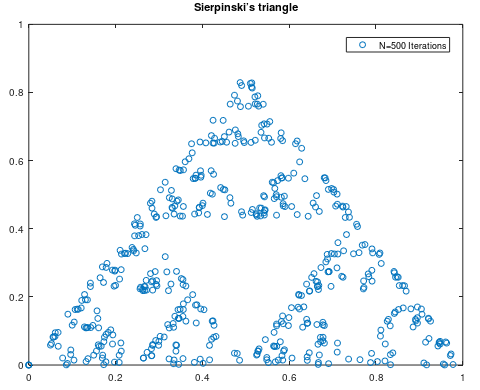
The Sierpiński triangle is a renowned fractal named after mathematician Wacław Sierpiński. It is constructed by recursively removing triangular sections from an equilateral triangle. Starting with a solid triangle, the process involves dividing it into four smaller triangles and removing the central triangle, repeating this step for each remaining triangle. The result is a striking pattern that exhibits self-similarity, where each smaller triangle mirrors the overall shape. The Sierpiński triangle has a fractal dimension of about 1.585, highlighting its complexity despite being formed from simple geometric principles. It serves as a classic example in the study of fractals and their properties.
clc;
clear variables;
close windows;

clf

N=500;
x=zeros(1,N);y=x;r=x;
for a=2:N
c=randi([0 2]);
r(a)=c;
switch c
case 0
x(a)=0.5*x(a-1);
y(a)=0.5*y(a-1);
case 1
x(a)=0.5*x(a-1)+.25;
y(a)=0.5*y(a-1)+sqrt(3)/4;
case 2
x(a)=0.5*x(a-1)+.5;
y(a)=0.5*y(a-1);
end
end
plot(x,y,'o')
title('Sierpinski’s triangle')
legend(sprintf('N=%d Iterations',N))
Fractal tree

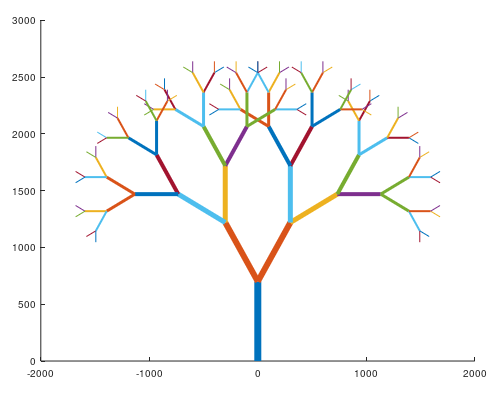
A fractal tree is a captivating representation of self-similarity found in nature, mimicking the branching patterns of actual trees. It is generated using recursive algorithms, where each branch divides into smaller branches at a specified angle and ratio, creating a tree-like structure. The process begins with a single trunk, which bifurcates repeatedly, producing a visually striking and infinitely complex pattern. Fractal trees are characterized by their varying shapes and sizes, resembling natural phenomena such as ferns and shrubs. They serve as excellent illustrations of fractal geometry, showcasing the interplay between simplicity and complexity in mathematical modeling and artistic design.
function treemain
tic
clear all;
depth = 7;
figure 1;
hold on;

drawTree2(0, 0, 90, depth);
toc;
endfunction

function drawTree2(x1, y1, angle, depth)
deg_to_rad = pi / 180.0;
rot=30; #degrees :: rotation from second iteration
branchLength=100*depth;
if (depth != 0)
x2 = x1 + cos(angle * deg_to_rad) * branchLength;
y2 = y1 + sin(angle * deg_to_rad) * branchLength ;
line([x1, x2], [y1, y2],'LineWidth',depth);
drawTree2(x2, y2, angle - rot, depth - 1);
drawTree2(x2, y2, angle + rot, depth - 1);

endif
endfunction


