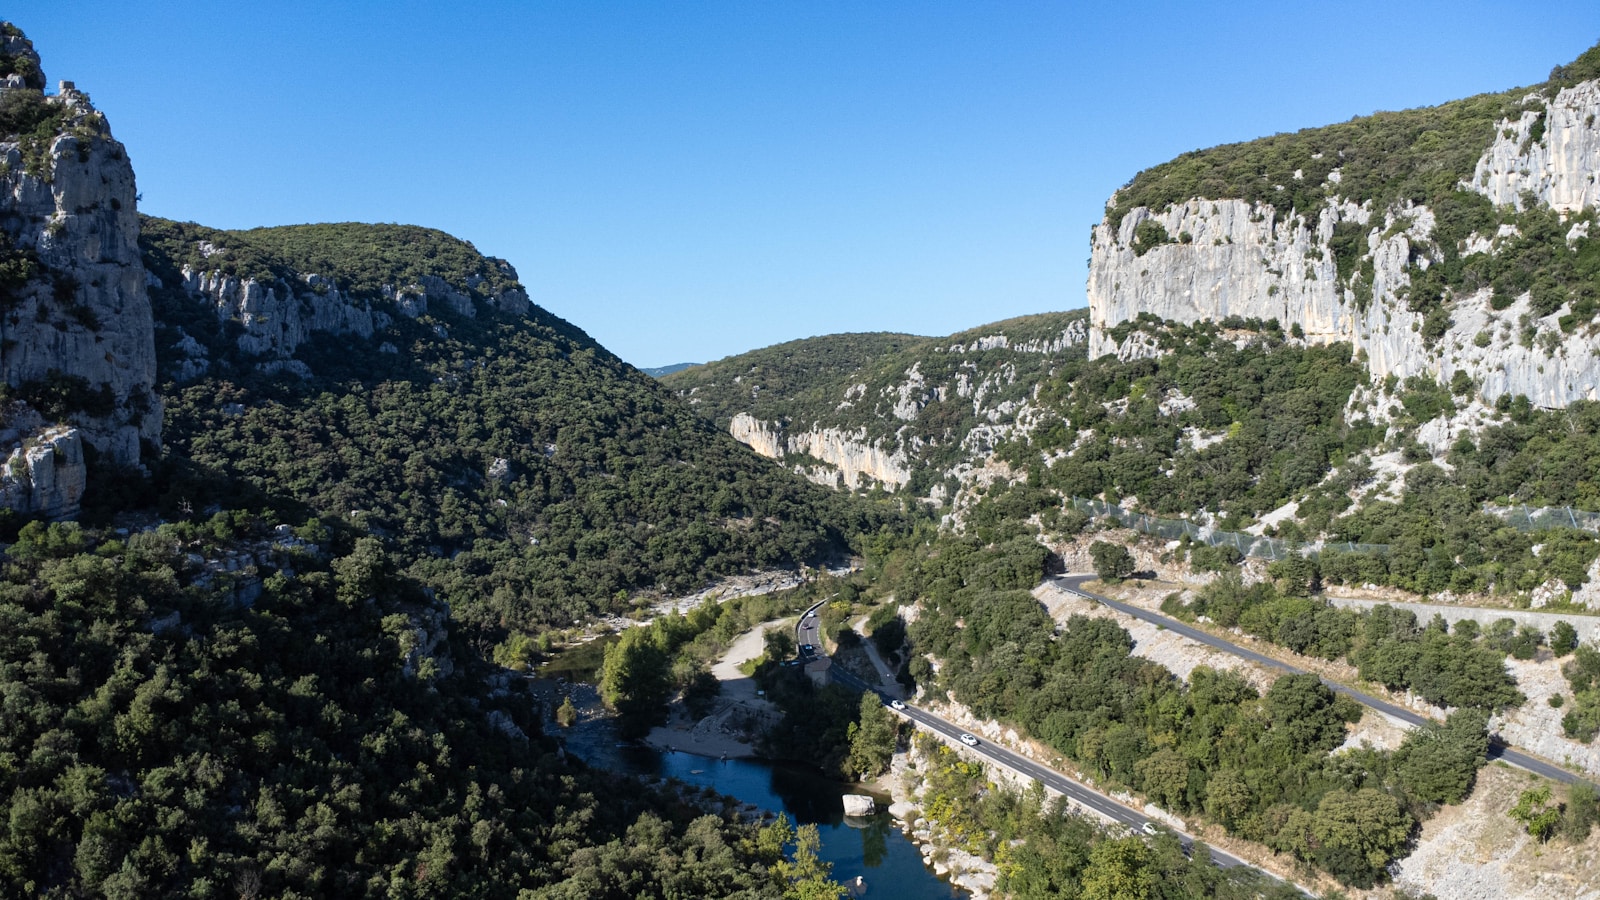
QGIS is a powerful open-source geographic information system that enables users to visualize, analyse, and interpret spatial data with remarkable flexibility. Widely used by researchers, urban planners, and environmental scientists, QGIS supports a vast array of formats and provides a rich set of tools for various geospatial tasks.
Steps to obtain catchment area in QGIS
The method is similar to any other GIS method. The steps are as follows; the main step is highlighted in bold fonts. It is up to you to beautify the map.
Calculating a catchment area involves using DEM files to analyse terrain and hydrology. By reprojecting the DEM, filling data inconsistencies, and applying Strahler order analysis, users can delineate the catchment effectively. This process is essential for understanding water flow and managing resources within a specific geographic area.
- Obtain DEM Files: Download the DEM files from a source such as Earth Explorer. If necessary, clip the files to reduce computation time.
- Reproject the DEM: Convert the latitude/longitude DEM file to a metric system, such as UTM. This step is crucial for area-based analyses.
- Navigate to: Raster > Projection > Wrap
- Ensure that the projection coordinate system of the DEM matches that of your data frame.
- Fill Inconsistent Data: Fill any gaps in the projected DEM.
- Use: Processing Toolbox > SAGA > Terrain Analysis (Hydrology) > Fill Sinks (Wang & Liu)
- Calculate Strahler Order: This calculation helps identify river lines, ensuring your intake location aligns with the Strahler lines.
- Navigate to: Processing Toolbox > SAGA > Terrain Analysis (Channels) > Strahler Order
- Note: Steps 3 and 4 can be combined using the command: Processing Toolbox > Terrain Analysis (Channels) > Channel Network and Drainage Basin.
- Delineate the Catchment: Use the upslope command. Input the X,Y coordinates that lie on the Strahler line and filled DEM, ensuring the coordinates are in meters (projected coordinates).
- Navigate to: Processing Toolbox > SAGA > Terrain Analysis (Hydrology) > Upslope Area
- Convert Raster to Vector: Transform the delineated raster into a vector format.
- Go to: Raster > Conversion > Polygonize (Raster to Vector)
- Update Attribute Table: In the attribute table, add a new field using the formula “$area” to calculate the area in square meters.


